


By the Numbers: The Maine Legislature
How a political culture changes

Perhaps this post is too much inside-baseball for those not from Maine, but it applies to any state if you want to look at those yourself.
Data always tells a story. In the case of studying the US Navy during the 1830s for my doctoral dissertation (later published as my book “On Wide Seas: The US Navy in the Jacksonian Era”), on of the many data sets was a smaller one like this on commissioned ships:

became this:

or reading through 316 court-martial records during this period and synopsizing them to show the individual, rank, ship, station etc started as this:

that became these and others:


From those data sets and graphs, anomalies appeared and, from those I could build pages, sub-chapters and sub-chapters to explain them like the unstated naval policies, ship material and morale conditions, or naval culture.
In a previous post a few months ago, I mentioned that too much media attention is focused on presidential politics and not enough coverage on the Senate or House races. This is doubly-so for state legislatures.
Studying state legislatures is important for two reasons. First, these are the elected officials who, arguably, have more direct impact on the lives of citizens, businesses, etc. Second, they are also, again arguably, more accountable to the average citizen for the simple reason of proximity. State legislators, by and large, are seen more regularly at local grocery stores or a community knows where they live to stop by and ask for help or express a problem (we had a lot of folks dropping by the house for those reasons, and my mother was directly accountable not only every election cycle but every day to her constituents.)
There is also the issue of history - oral histories are common among presidents and their staffs and some Senators and House members. Less so state legislatures. This always struck me as a lost opportunity. In one case in my state, one individual served over a period of nearly sixty years, saw everything at the state house, witnessed the rise of legislators from the state AA or AAA farm team to the major leagues representing the state in Washington. They understand the history of the policies or attempts at policies.
For Maine, it, like other New England states, has changed demographically in many ways and has shifted over the past few decades from a “purple” state to a “blue state.” There are many factors but for this post I looked at the make-up of the legislature. I’ll be discussing these tomorrow (Thursday) somewhere between 0800-1000 Eastern on The Ray Richardson Show (wlobradio.com).
As with my extensive study of the Navy in the 1830s, I started with a simple spreadsheet with the name of each legislator then deciding on a few basic pieces of information that might be readily available - political party, gender, county they represent, profession, where they were born. If I had the time, or if a PhD student looks for a topic to continue this, I would have added how much legislative service they had, religion, schools attended, number and composition of family members, etc. Why? Because all of these elements influence how a person might vote or how collectively the legislature or parties in the legislature develop a political culture that will decide what issues are priorities.
In the majority of cases, the information was easy to come by with the exception of place of birth - some have it on their campaign website and elsewhere. Some don’t want to, usually because they were “from away” as we say in the state.
This, like the navy study, is how it started:

First, here’s the breakdown by the counties they represent and political affiliation indicating the strength of the southern Maine contingent in Cumberland and York counties and why the 2nd Congressional District electoral vote was won by Trump in all three of his elections:


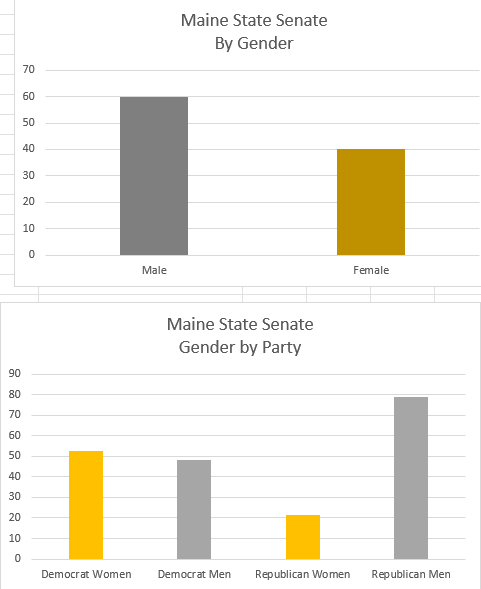
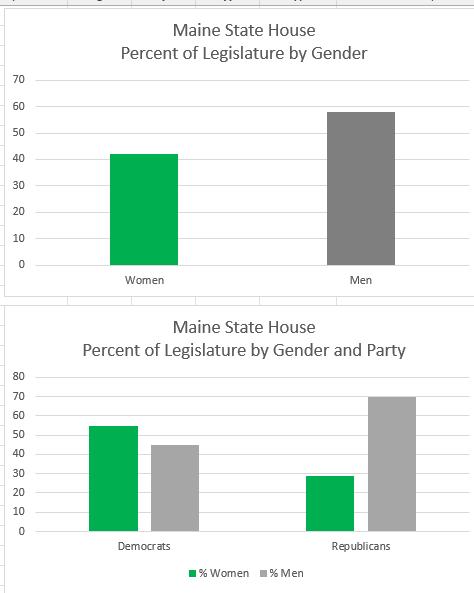
Breakout by Gender and Political Affiliation:
By profession (I did not include those where they were the only one with a particular profession except the smaller body of the Senate):


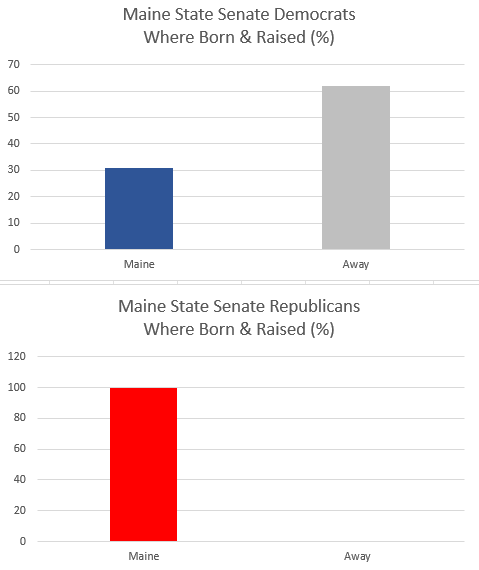
But the following is where I found the biggest surprises - where legislators were born


I then included “Unknowns” assuming “Away”. I had a higher degree of confidence (about 75%) on this given the locations and types of colleges they attended:
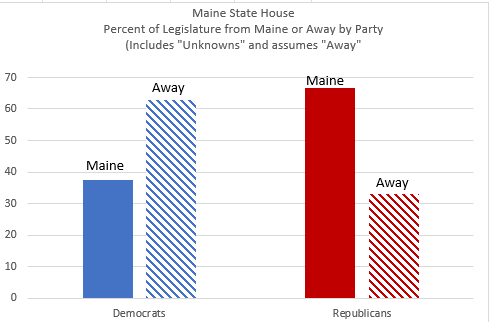
I did a similar survey about 10 years ago and only about 30% of the House could be categorized as “from away.”
Thirty years ago, Republicans in the US Senate were from Maine, New Hampshire (2), New York, Pennsylvania (2), New Jersey, Delaware, and Virginia. Until last month’s election, Sen. Collins of Maine was the only Senate Republican until you hit Ohio or North Carolina. The same is true on a micro level for Maine. State coastal counties like Knox, Sagadahoc, Waldo, Hancock, etc were largely Republican strongholds until the 1980s/90s. But comparatively inexpensive Maine real estate became attractive to those “from away” who had more financial means. The properties especially in southern Maine and the coast were bought up - and COVID had an exponential effect as it was not uncommon for a Mainer looking to purchase a property was up against twelve or thirteen bidders with cash rather than cumbersome loans (I had plenty of experiences on that issue during COVID.) There were also very large populations of asylum seekers who were provided housing in a few of the cities that accounted for political changes, particularly in a small state that is the or one of the oldest in the nation as generations have moved out of state for job opportunities.
What all of this did was fundamentally alter the political positions and policies of the state as a whole and that is largely reflected in the graphs above.
It appears that Maine has a carpetbagger problem, very similar to that of New York regarding the election of Mrs. Clinton.